Debugging JBoss AOP Apps Tutorial - Part 1
In this tutorial we are going to show you how you can debug an application that uses JBoss AOP using Eclipse.
For this, you need to have your project set up in Eclipse without compilation errors.
Now, follow in these steps:
- Open the debug drop-down menu and click on Debug... as shown in the image below:

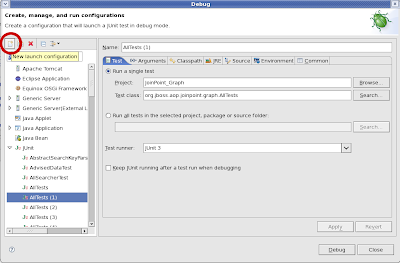
- On the Debug window, click the New launch configuration button:
- Configure your test as you would if your application didn't use JBoss AOP.
- On the Arguments tab, add the
javaagentargument and define the system property“jboss.aop.path”as in the example:
-javaagent:/home/fla/Development/workspace/jboss-aop/aop/output/lib/jboss-aop-jdk50.jar
-Djboss.aop.path=/home/fla/Development/workspace/MyApp/src/resources/jboss-aop.xml
Notice you have to fill those values with the path of the jboss-aop-jdk50.jar and the jboss-aop.xml in your system.

Now you are ready to go. Just add the breakpoints to the points you want to debug and start the debugging.
In the next part of this tutorial, we are going to explain the JBoss AOP classes you will run into when debugging and what you need to know about them in order to debug your application and your aspects successfully. Stay tuned!
No comments:
Post a Comment