Friday, December 5, 2008

Debugging JBoss AOP Apps Tutorial - Part 3

This is the final part of our tutorial on debugging. In this part, we will show how to debug the overloaded-advices example step by step. This example comes bundled with JBoss AOP release, so all you need to do is to download the 2.0.0.GA release and start following the next steps.

First, create a project for the overloaded-advices tutorial example using Eclipse (the URL location is jboss-aop-2.0.0.GA/docs/aspect-framework/examples/overloaded-advices) and solve classpath issues by adding the JBoss AOP jars to the classpath (just include the jars of the jboss-aop-2.0.0.GA/lib directory).

Now, add a breakpoint to the Driver class, line 29, where there is a call to POJO constructor, the first joinpoint of the example that will be intercepted:


Configure a Java Application execution to run the Driver class, setting the AOP arguments as has been showed in the first part of this tutorial.

  1. Start debugging this application.
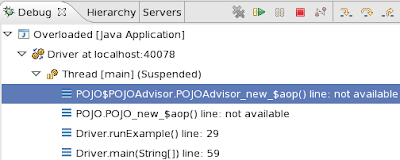
  2. Once Eclipse stops at line 29, press F5 to enter the constructor execution joinpoint. This is what you are going to see:


  3. You see that the previous step resulted in a stack trace that shows a wrapper method belonging to the POJO class: POJO.POJO_new_$aop(), followed by the wrapper that is our focus of interest, the one belonging to the Advisor class: POJO$POJOAdvisor.POJOAdvisor_new_$aop().
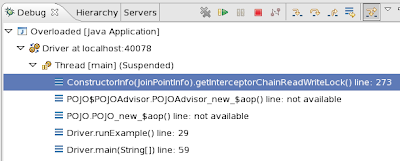
    However, the top line of the stack is one of the “noises over the line” mentioned in the previous tutorial part. That line is a call to a ConstructorInfo method that returns some a sort of concurrency lock. So, press F7 to return to the Advisor wrapper method. Once you do this, you should see the stack trace below:


  4. Whenever you are in the Advisor wrapper method, you should press F5. This is what we get once we press F5:


  5. Oh no! Another “noise”. This time, more code handling locks. Now you know what to do. Press F7, return to the wrapper method, and press F5 on this wrapper until you enter a new block of code. Continue this process until you have finally entered the Joinpoint class.
    These are the “noises” you will run into during this process:


    Note that the second “noise” (ConstructorInfo.hasAdvices()) will appear twice in a row.
    After step returning those “noise” elements with F7, Eclipse finally enters the first advice execution:


  6. Once you get to the advice, debug it as you would normally. As this is a just tutorial, we are going to press F6 until we return to the Joinpoint class:


  7. Back to the JoinPoint class. Press F5 until you find the next advice. Before getting there, you are going to run into another couple of “noise” elements:


    On the screen above, you see an info call at the top of the stack. As mentioned previously, this is something you should skip with F7. Right below it in the stack, there are three calls to constructors (<init> methods). Again, we have mentioned previously that calls to constructors should be skipped with F7. Skipping them and then pressing F5 will take you to the next advice:


  8. You should debug this advice as you did in step 6, with F6. There is one line, however, that you must treat differently and press F5: line 39 of JoinPointAspect, containing the statement return invocation.invokeNext();

    This line, as you should know, is going to invoke the next around advice. If there are no around advice, it is going to call the joinpoint itself. So, if you want to debug the POJO constructor execution, you must enter the invocation.invokeNext() call. After pressing F5 in this line, you will see the following stack:


  9. At this point, you have reached the joinpoint being intercepted. Whether it is a method or constructor, you can debug it as if this was a normal Java application. If it is a field set or a field get, you are not going to be able of debugging it though. But you can check the new value of the field after a field set joinpoint once you get back to your normal application at step 13.
    In this case, the joinpoint is a default constructor, so there are no lines to debug at all. Just press F6 to return to the previous item in the stack:


  10. So, we are back to the Joinpoint class. Now, you should press F5 again following the tips given in step 5. Doing so will take us to the last advice:


  11. Repeat step 6 now, pressing F6 to return to the Joinpoint class:


  12. Pressing F5 now does not take us to the next advice,as all advice have already run. It takes us back to the advisor wrapper method.


  13. You are done! Just press F7 twice to exit both wrappers and go back to the driver class. Now you can continue debugging. Try to enter the next joinpoints of the overloaded-advices example to see the other advice running! Remember that you must press F5 on field read and field write joinpoints, in order to enter their wrapper method code.


Next Steps

Once you have walked-through the steps to debug the overloaded-advices example, you are ready to debug any other JBoss AOP application you like. Try doing so using a different JBoss AOP tutorial, or just try debugging your own JBoss AOP application.

The next time you need to debug an application that uses JBoss AOP, I hope it is going to be easier for you to track bugs down with the tips we have presented in this tutorial. Good luck!

Saturday, November 29, 2008

Aophelper

With the release of JBoss AOP 2.0.0 we also included a few new tools. One of them is an application we called Aophelper. The idea behind it was to create a tool for people to use aop without the hassle of setting up aop jars, commandline options, creating an antscript etc. We tried to make an application to ease the use of aop or atleast make it easier for people to start using aop.

Aophelper is a small swing application that provide all the dependencies needed to run JBoss AOP and has features to add options to JBoss AOP. Aophelper has two modes; compile mode and run mode (use the File menu to change between the modes). They are nearly identical (visually), but the do different things. Here is a view of the compile mode:


- a larger picture can be found here.

The compile mode will try to aop compile classes specified by a path. If additional jars are needed, they can be added to the classpath. Then finally we need to specify a jboss aop xml file. After this is we can press compile and all the classfiles that where specified by the working directory option will be aop compiled.

The run mode will try to run either a aop precompiled program, or it will run the program with loadtime weaving (aop is weaved into the class when the program starts, no changes are done to the .class files). Here is an example of the run view:

- a larger picture can be found here.

The only difference between run and compile mode is the input field were you add the main execution class and the checkoption to choose if you want to enable runtime weaving. Aophelper can also save your settings so its very easy to get back on track with an application you've used before.

Even though Aophelper support most of the basic aop functionality, Aophelper is currently in a beta stage where much will change and additional features will be added. Some points we have on the todo list:

  • Export settings to a simple ant build file
  • Rewrite ui to make easier to use and support size changes
  • Better errorhandling

Aophandler is bundled in the JBoss AOP distro. Go into the aophelper directory and run it by executing either aophelper.sh on linux/mac/etc or aophelper.bat on windows.

You can always use the latest version from svn. Download JBoss AOP and run: mvn install -Prun-aophelper inside the aophelper directory and you can check out the latest changes.

Tuesday, November 4, 2008

Debugging JBoss AOP Apps Tutorial - Part 2

In this part of the tutorial we are going to see what JBoss AOP classes and methods are involved in the call of advices, so you know how to interpret those when they appear during debugging.


Which classes call advice and trigger intercepted joinpoints?

When a joinpoint is weaved, its code is replaced by code generated by JBoss AOP. This new code wraps the original joinpoint code, in a way that your original joinpoint is still going to execute, but a few steps later. As this code is generated by JBoss AOP, you will not be able of seeing the code lines being executed during debugging. That is ok. You should keep in mind only what are the main tasks involved in each step and press F5/F6/F7 until you enter your advice or joinpoint code.

This is the sequence of the elements involved in the execution stack when a weaved joinpoint is executed:

Advisor -> JoinPoint -> advice + joinpoint

As you can see, there are two helper classes involved. One of them is the Advisor class. Specifically, the wrapper method contained in this class is responsible for calling methods on the JoinPoint class. And the JoinPoint class is the one that is actually going to invoke your advice and your joinpoint, the points that you want to be able of debugging.

Advisors

An Advisor is responsible for managing interception of your classes. There is an Advisor per intercepted class, which manages all the advice stacks related to that specific class. Similarly, there is an Advisor per instance and this advisor is going to appear at your execution stack only when there is specific configuration per instance, which is rare.

From version 2.0 on, the default weaving mode is the generated-advisor mode. From this point on, we will assume you are using this mode. In this mode, advisors are also responsible for generating code that will invoke your advice and joinpoint, and for invoking this code as well.

It is very easy to identify an advisor on the debugging stack trace. The advisor of class POJO is called POJOAdvisor, and is an internal class of POJO. In this case, you are going to see POJO$POJOAdvisor as the name of the advisor class in the stack trace.

Wrapper Methods

Every time a joinpoint is weaved by JBoss AOP, this joinpoint execution is replaced by a call to a wrapper method. These methods know what to do to trigger execution of your advice and the intercepted joinpoint.

The signature of a wrapper methods varies according to the type of joinpoint you are intercepting. For example, the wrapper of a method called public void run(Withdrawal) would have the signature:

public void run_N_8003352271541955702(Withdrawal)

Once you start debugging, you

will get used to the signatures of wrapper methods and will start recognizing them right away. For now, there is a simple rule you can use to identify those. They are part of generated advisors and are the first extra item that will appear on the stack trace when you are debugging an intercepted joinpoint.

That said, if the method run of the previous example belongs to a class named Withdrawal, you are going to see something like this:


Note that for some types of joinpoints, such as field read and constructor execution, you are going to see an extra wrapper method at the stack. This extra wrapper has the same signature as the wrapper belonging to the Advisor class, but it will instead belong to the class that contains the joinpoint being executed:


In this picture, we see that there are two wrappers: intField_w_$aop(Object, int), belonging to the POJO class, and POJO$POJOAdvisor$intField_w_$aop(Object, int), belonging to to the POJOAdvisor class.

Notice that those method names do not indicate a exotic taste, as they are made this way so we can avoid crashing with any name of other classes/fields/methods you may have included in your application. Plus, those method names make it easier to identify code generated inside of JBoss AOP.


JoinPoint classes

A JoinPoint class is generated for each joinpoint of your system. Their names always start with "Joinpoint", followed by something that identifies the joinpoint they represent, like the example below:

JoinPoint_run_N_80033522715419555702_2

JoinPoint is your main class of interest here. Despite the fact that you ca not see its code or the lines being executed when debugging, this class is responsible for calling your aspects and invoking the joinpoint they represent as well. So, if you have advice A and B intercepting execution of, say, void myMethod(), it is the JoinPoint class that will invoke A, B and myMethod as well.

The entry point for the JoinPoint class is the invokeJoinPoint method:


When debugging this method, and the inner methods it calls, you want to use F5 so you can enter your advice and joinpoint codes in order to debug them.


Noise over the line

The elements presented in the previous section are not the only ones you are going to face when debugging your weaved joinpoint. Other calls will appear in the stack. While the elements you are going to see are important for the inner working of JBoss AOP applications, they are not your focus of interest when debugging.

So, the following elements of the stack trace are not going to take you to the execution of advice or the weaved joinpoint, and that is why we say they are “noise over the line”:


  • Info classes: are helper classes that contain information related to each joinpoint (such whether there are advice to be applied to that joinpoint, and which advice are those). Sometimes, the JoinPoint class will enter an info class to query that type of information. The main info classes are: FieldInfo, MethodInfo, ConstructorInfo, MethodByMethodInfo, ConByMethodInfo, ConByConInfo, and MethodByConInfo.


  • Constructors: as you probably know, they are represented by the word on the stack trace;


  • Concurrent lock code: code that makes sure that interception is thread-safe;


  • JoinPoint class generation: the JoinPoint class we mentioned in a previous section is generated at the first time a specific joinpoint is reached:


  • Call to any other JDK class: though it is rare, you may run into a call to a JDK class when debugging a weaved joinpoint

All the points contained in the previous list should be skipped. So, whenever you see those, just press F7 to return to one of the points mentioned in the “Which classes call advice and trigger intercepted joinpoints?” section.


Debugging a joinpoint


Once you are more familiar with the elements presented in the previous sections, you are
ready to start.

Before continuing, lets recall what are the keys you can use during Eclipse debugging and what they represent:
F5: Step into
F6: Step over
F7: Step return

These are the steps you must follow when a weaved joinpoint is reached:


  1. The joinpoint is reached. The first thing you will notice is that, despite you can see the joinpoint code in your application, Eclipse will flag that it cannot find the line correspondent to the joinpoint. This is expected and indicates that your joinpoint has been weaved. Press F5 to enter the wrapper method.

  2. Now you can see the wrapper method of the Advisor class in the execution stack. This is the method that is going to invoke the JoinPoint class, so press F5 again.

  3. This is the tricky part. Besides invoking the JoinPoint class, the wrapper method performs a couple of other actions: enabling concurrent lock and invoking code to generate the joinpoint class are a few of those. Those actions are what we called “noise over the line”. Whenever you enter a block that is not part of the JoinPoint class, press F7 to return to the wrapper method.

  4. When you finally get into the JoinPoint class, press F5 constantly, until you enter your advice.

  5. If , before getting to your advice or joinpoint, you run into constructors ( elements in the stack), info methods, or any call to a JDK class, you should press F7 to return to the Joinpoint class;

  6. When you enter an advice, Eclipse will start recognizing the line numbers again and you will be able of debugging your advice just as any normal method of your application.

  7. The same holds for your joinpoint. If your joinpoint is a method or constructor, you are going to be able of entering those and debugging them normally.

  8. Once all advice and the joinpoint have been executed, the JoinPoint class is done with its work and execution will return to the wrapper method. When this happens, press F7 until you return to your normal application code.

TIP: When debugging around advice, remember of pressing F5 on the call to Invocation.invokeNext(). Or you won't be able of seeing the execution of other around advice, nor the execution of the joinpoint being intercepted.

In the next part of our tutorial, we are going to illustrate the steps above, walking you through a debugging process over Eclipse. See you there!

Tuesday, October 21, 2008

JBoss AOP 2.0.0.GA Released

JBoss AOP 2.0.0.GA has been released. It can be downloaded from here, the full release notes can be found here, and the updated documentation can be found here.

A lot of bugs have been fixed. Amongst all the new features, a few deserving special mention follow. A new weaving mode which allows before/after/throwing/finally lightweight advices has been introduced. The new weaving mode also allows more granular dynamic aop. It also integrates with the JBoss MicroContainer, which is in the core of JBoss 5, meaning that aspects are now being used in the core of JBoss 5! There is also some support for interception of access to array elements.

As usual the whole team has worked hard towards this release, but thanks to Flavia Rainone for working round the clock in the run-up to the release and to Ståle W. Pedersen for helping out a lot despite being on paternity leave. Finally, thanks to Paul Gier for helping move our build over to use Maven.

Upcoming features in the short term are a nicer way to add dynamic aop constructs, and an understanding of the OSGi classloaders in JBoss 5.

Tuesday, September 30, 2008

Debugging JBoss AOP Apps Tutorial - Part1

Now and then I run into users complaining they don't know how to debug JBoss AOP applications. Targetting those users, I decided to write this tutorial, that will explain you the basics on debugging JBoss AOP application to have you started right away. As we will see, it is extremely easy to debug a JBoss AOP application using an IDE as Eclipse. The tricky part is how to set up your environment and to get familiar with the JBoss AOP classes that will trigger your advices.


Debugging JBoss AOP Apps Tutorial - Part 1

In this tutorial we are going to show you how you can debug an application that uses JBoss AOP using Eclipse.

For this, you need to have your project set up in Eclipse without compilation errors.

Now, follow in these steps:

  1. Open the debug drop-down menu and click on Debug... as shown in the image below:

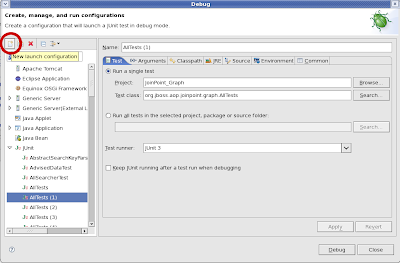
  2. On the Debug window, click the New launch configuration button:


  3. Configure your test as you would if your application didn't use JBoss AOP.
  4. On the Arguments tab, add the javaagent argument and define the system property “jboss.aop.path” as in the example:

    -javaagent:/home/fla/Development/workspace/jboss-aop/aop/output/lib/jboss-aop-jdk50.jar
    -Djboss.aop.path=/home/fla/Development/workspace/MyApp/src/resources/jboss-aop.xml


    Notice you have to fill those values with the path of the jboss-aop-jdk50.jar and the jboss-aop.xml in your system.

Now you are ready to go. Just add the breakpoints to the points you want to debug and start the debugging.

In the next part of this tutorial, we are going to explain the JBoss AOP classes you will run into when debugging and what you need to know about them in order to debug your application and your aspects successfully. Stay tuned!

Tuesday, September 9, 2008

JustJava and JBoss Brasil

Hello everyone!

I have great news from Brazil. First, I'm going to do two talks at JustJava, the largest Brazilian Java event.
The title of the first talk is "Dynamic Aspect-Oriented Programing and Adaptable Systems", and it will be held tomorrow at 16:00h. The second one will take place on Friday, 12th and has the title "Designing a JavaEE Server with IoC and AOP - A Study Case".
If you are attending to JustJava this year, go check out my presentations and let me know what you think of those subjects.

The second news is that Edgar Silva has founded a Brazilian JBUG, the JBoss Brasil. I've added an internal group dedicated to JBoss AOP project exclusively. I you are Brazilian or at least speaks Portuguese, feel free to join our group. For those that don't speak Portuguese, you are always welcome to join our forums and feel free to contact us in case you want to get involved in JBoss AOP project.

See you around!

Thursday, August 28, 2008

DZone Introduction to AOP article

I have written an introductory article to JBoss AOP on DZone. It can be found here.